In July, 2021 the Dutch watersystem was confronted with a historical runoff of water. In the hours after the flood, the Tygron Team has processed all relevant data and tried to give as accurate insight as possible in where the water comes from and where it will go to.
Limburg and the Meuse
We have modelled the South of Limbrug entirely on a 3x3m grid. Based on data that is available online, we will be updating the model regularly the coming period.
Sources:
- Rainfall, we uploaded the past two days from: https://neerslagkaart.nl/
- Current water levels: https://www.waterstandlimburg.nl/
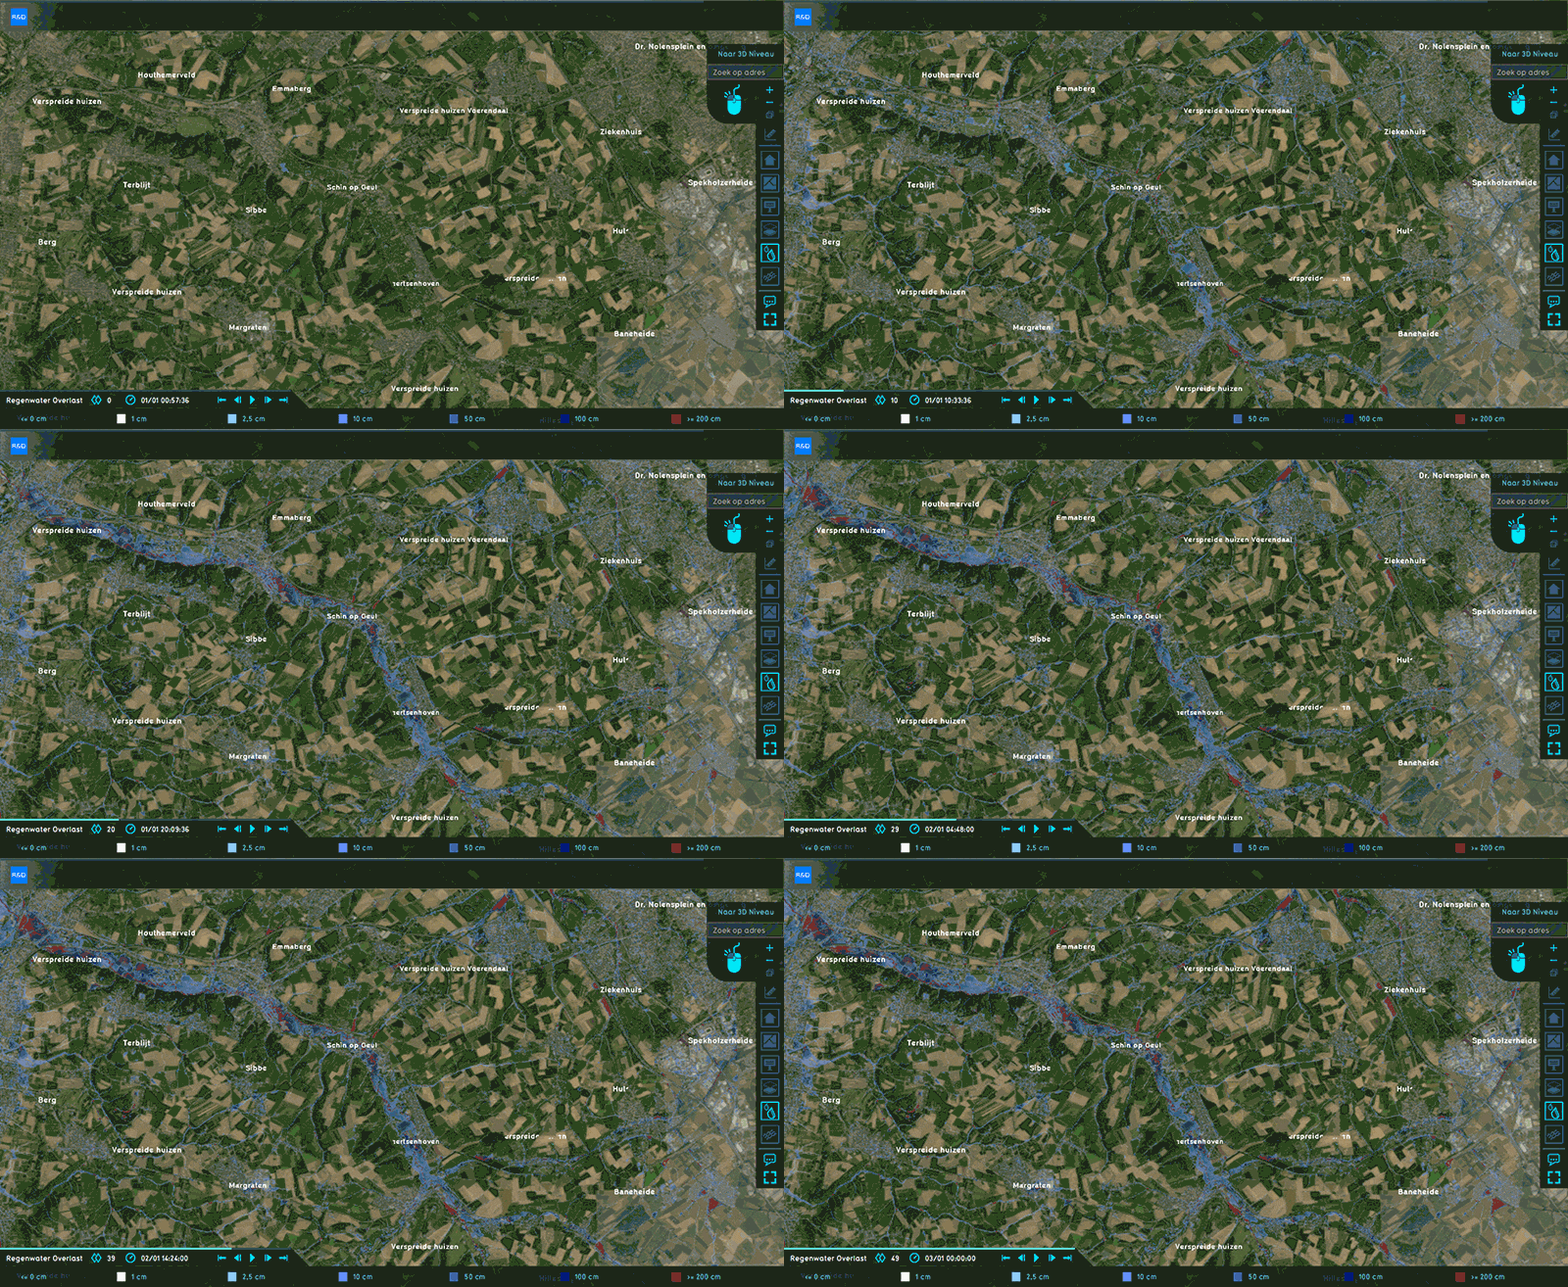
Here you can see an impression of the model:
With this model we can calculate the current values for the Meuse and the Geul at different locations. The model shows a ~20cm range from the measurements at the Geul, for a water level rise of 300cm. This shows that we can accurately approximate the current water levels with this model.
Flow in Valkenburg
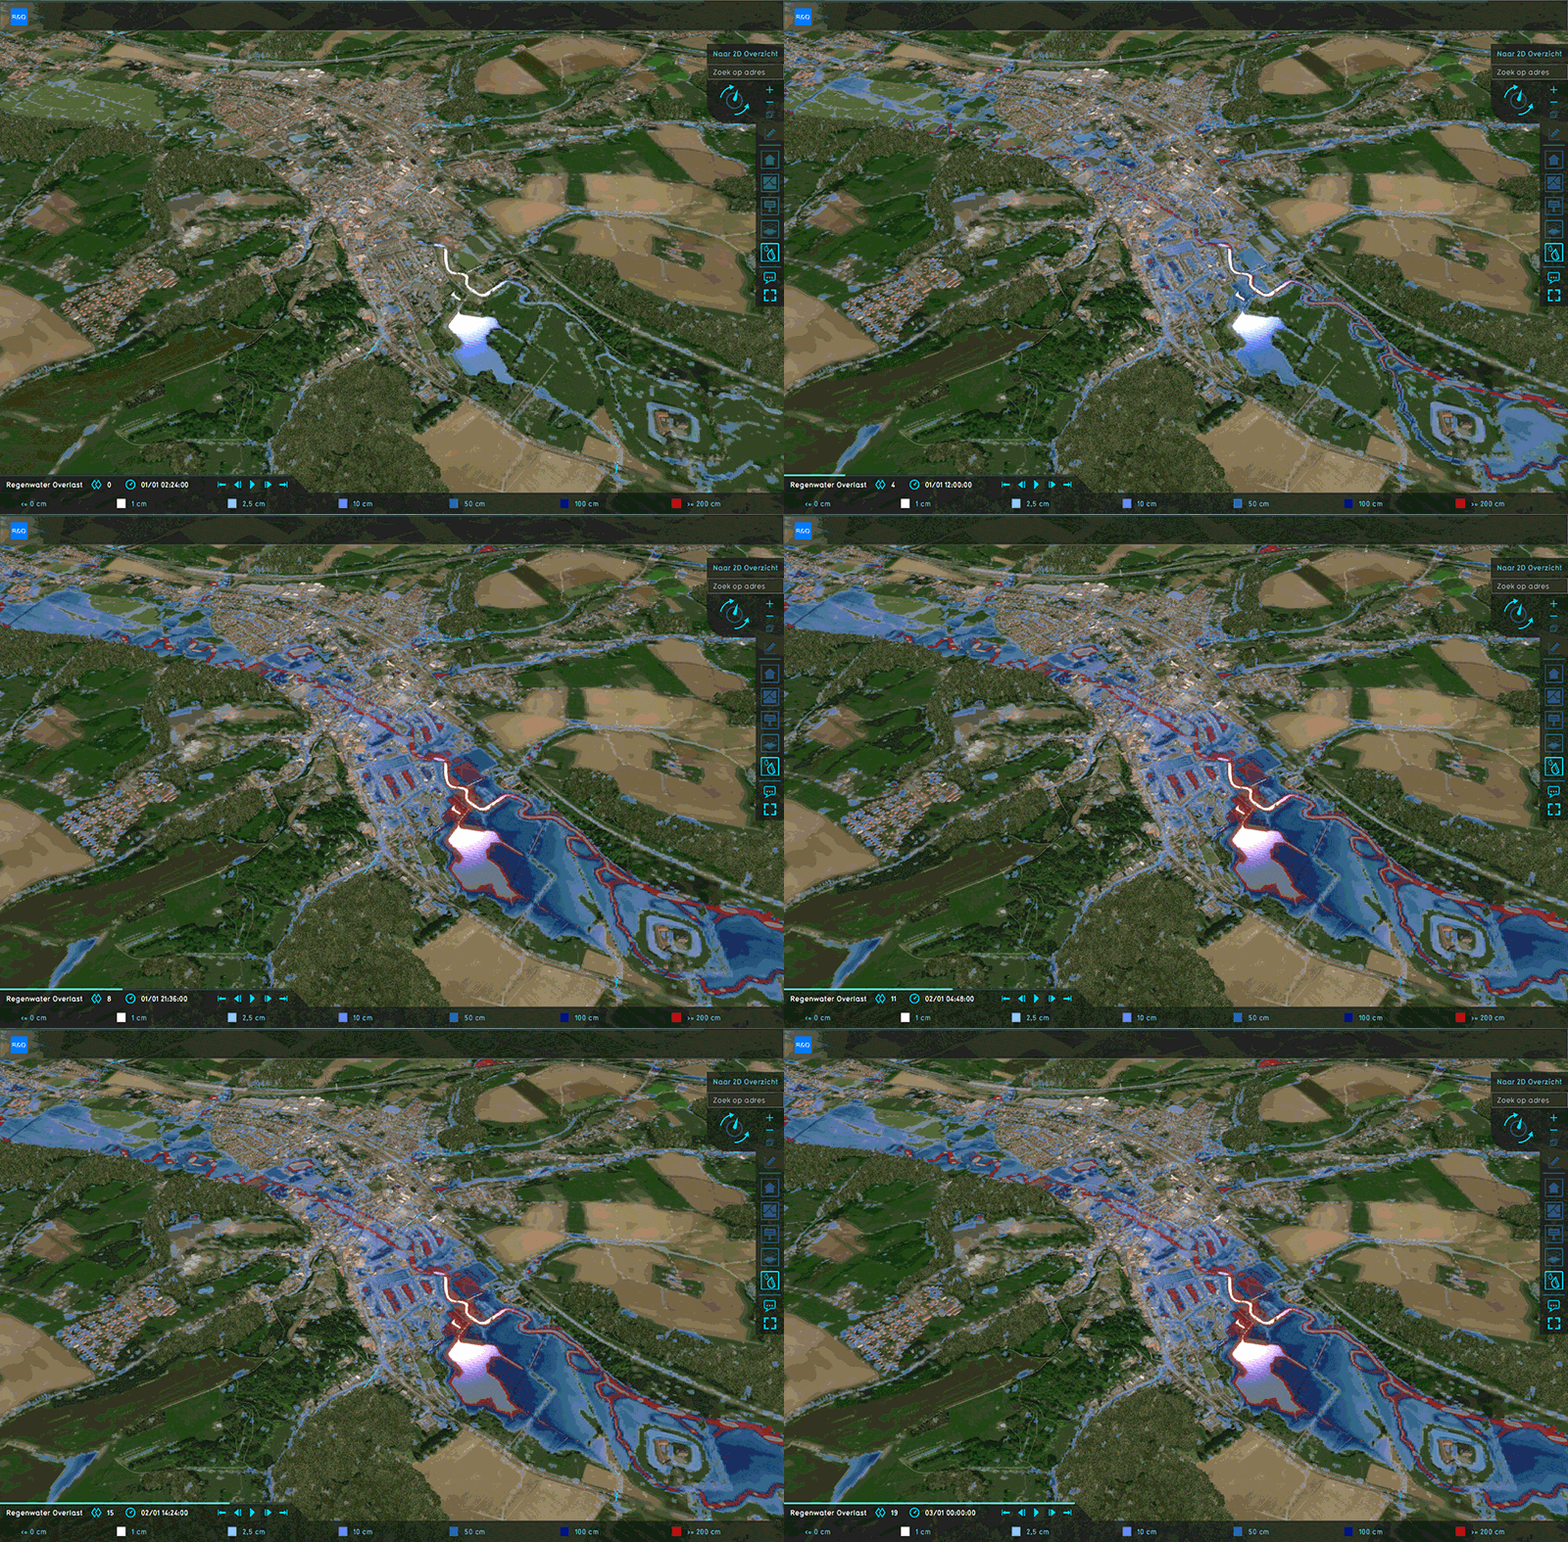
This clip shows the modeled water flow through Valkenburg:
Water buffer Hoensbroek
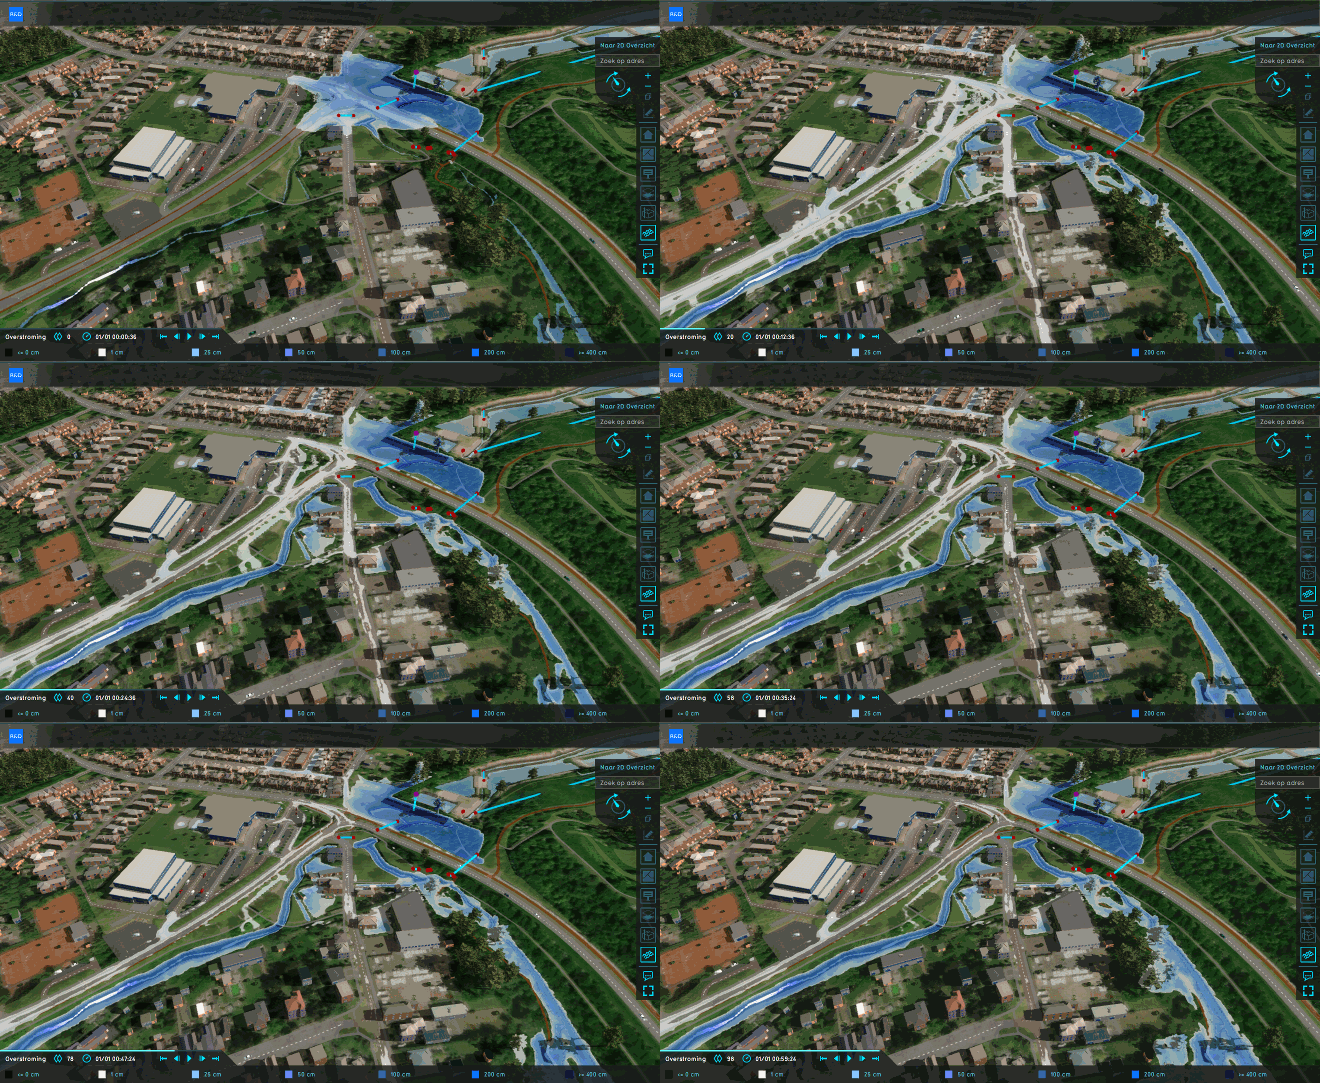
The Water buffer in Hoensbroek overflows; source: https://www.limburger.nl/cnt/dmf20210714_95459089
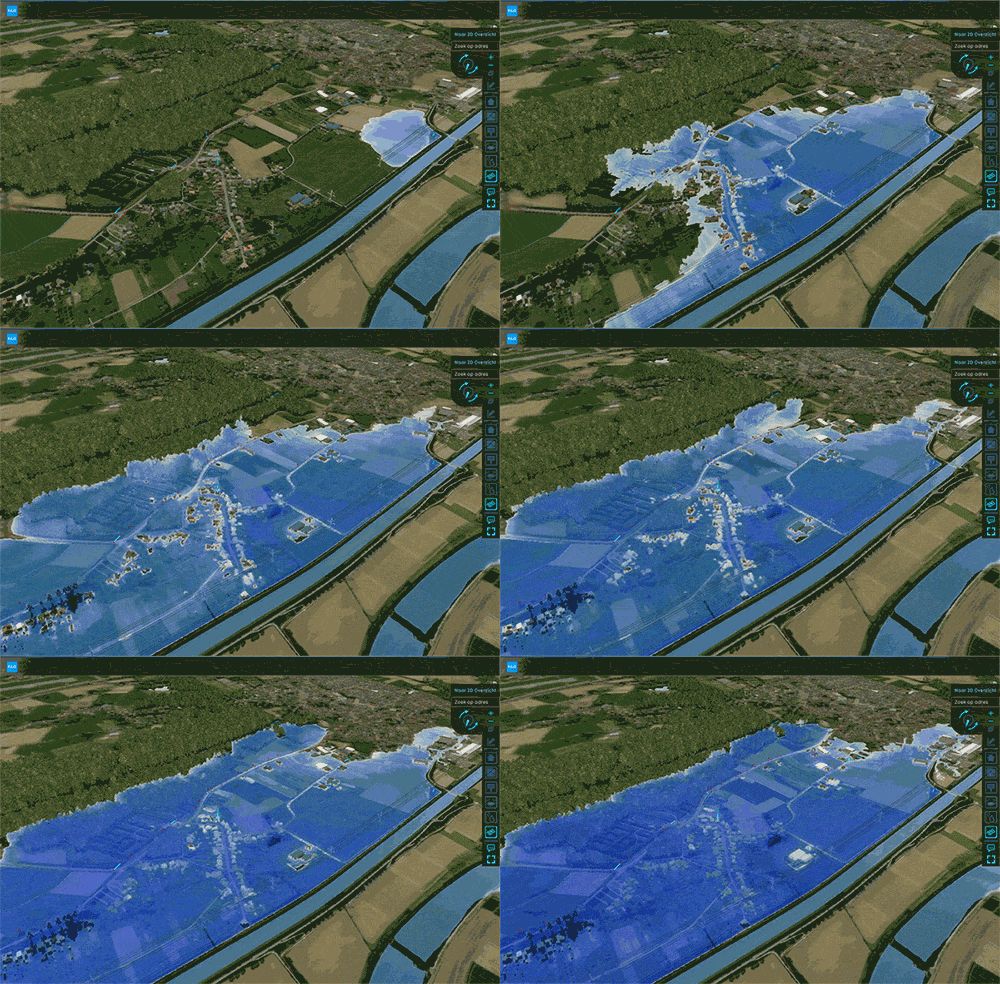
Breach at Julianakanaal
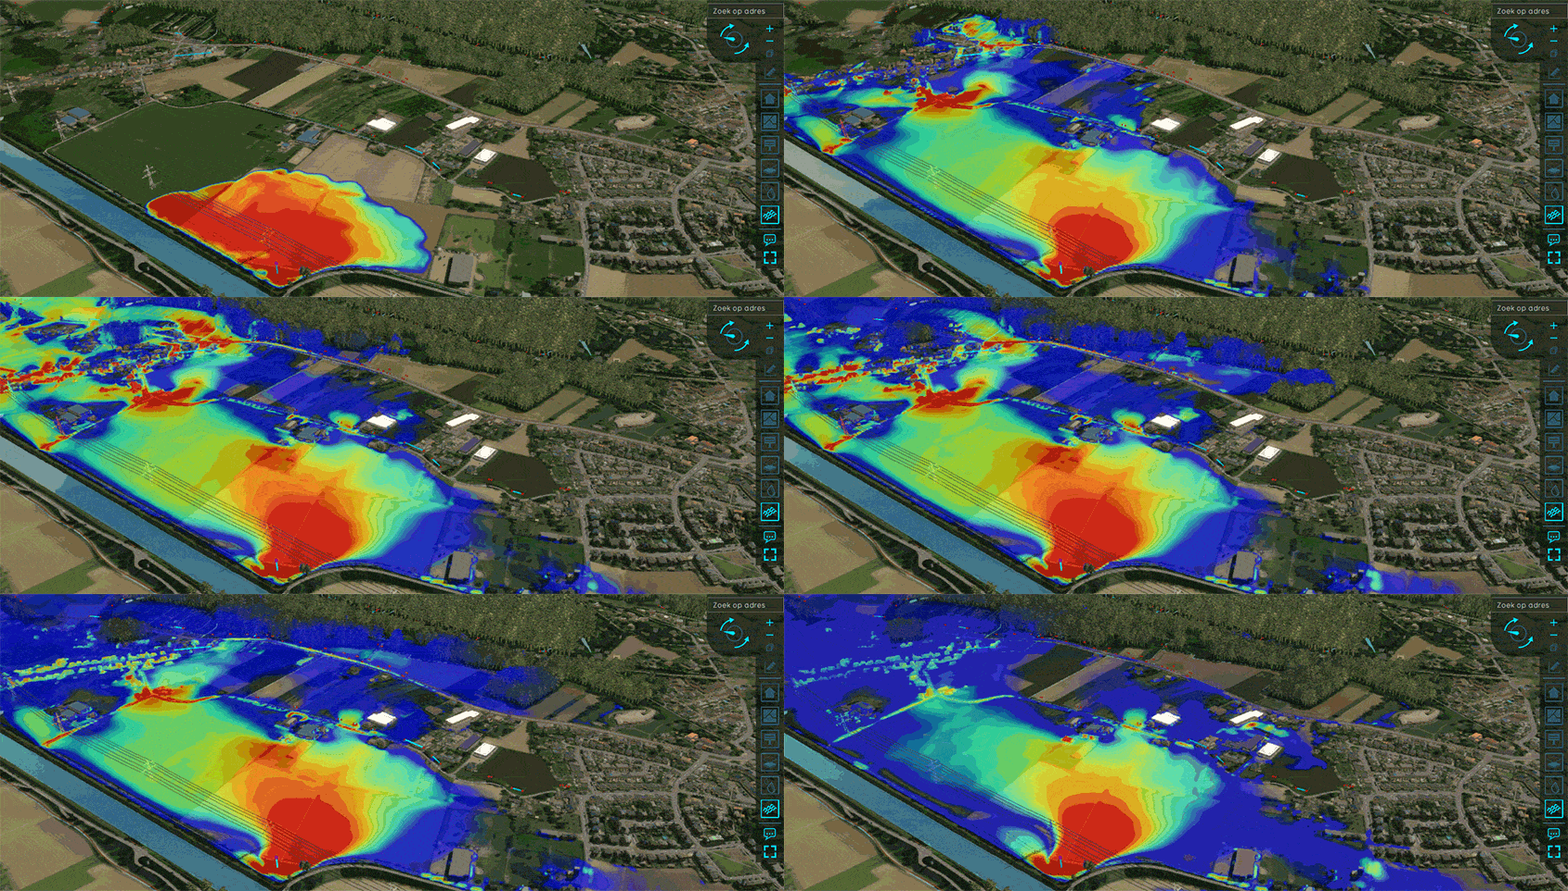
This clip shows the modeled impact of the breach that occured at Julianakanaal:
We have our models ready for all locations of the Dutch river system, with a direct connection tot the most up-to-data measurements.
In case you would desire to use this in the days after the flood, please contact us at info@tygron.com. We realise that in times of crisis help is offered from many sides and we think our models can help to interpret the events. We will be using all experiences from the last hours and days to support this.
