The Tygron API has been available to all Tygron users since the beginning of 2020. This opens up an endless amount of new possibilities for using the Tygron Platform. The Tygron API is well documented and compliant with the latest standards. More technical information can be found on our support wiki. The API makes it possible, among other things, to link your own models, analyzes and software applications. In this blog I list a number of practical examples:
Linking models: Green benefits in focus with the RIVM
The Green Benefits Planner developed by the RIVM (Dutch National Institute for Public Health and the Environment) is linked to Tygron via the API. This allows a user to enter or draw a scenario in Tygron’s 3D world and have it calculated by the RIVM’s Green Benefits Planner. The planner immediately sends the results back and they become visible in Tygron. In this way, an integrated assessment can be made: scenarios are calculated based on the benefits of greenery via the RIVM, but also on its impact on, for example, heat stress, flooding and parking space with the existing models in the Tygron Platform. The first version of the connection is used to explore a climate-proof design of a neighborhood in Amersfoort.
See more here
Linking real-time data
Via the API, real-time data can be linked to the Tygron Platform and used directly for analyzes and calculations. For example, the radar images of a shower can be read directly and the flooding resulting from this shower can immediately be calculated. For more information, watch the presentation by Rudolf Koster (developer at Tygron) during the CoP on 17 June 2021:
Automating hydrological calculations
Tygron partner TAUW uses the API to automatically perform bulk calculations and process relevant output in GIS, style it and write it to a file and report. This saves a lot of manual work and time.
Validate and calibrate
The water company for Amsterdam, Waternet, uses the API to set up a comprehensive water balance and validate and calibrate the model using historical measurement data.
More insight with dashboards
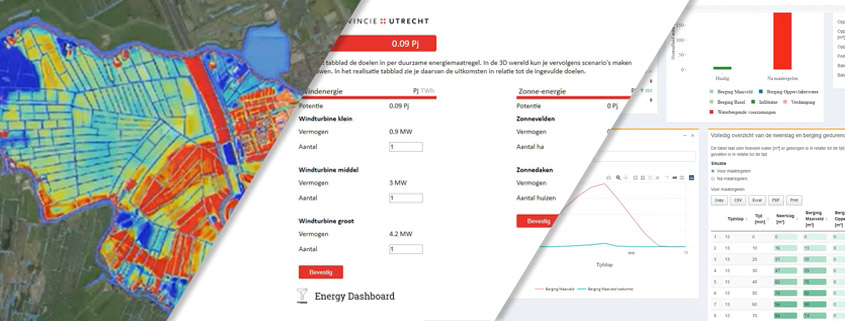
The API makes it possible to develop your own dashboard, to gain insight into your own indicators (KPIs) and to share them easily with those involved. An example is the Energy dashboard of the province of Utrecht.
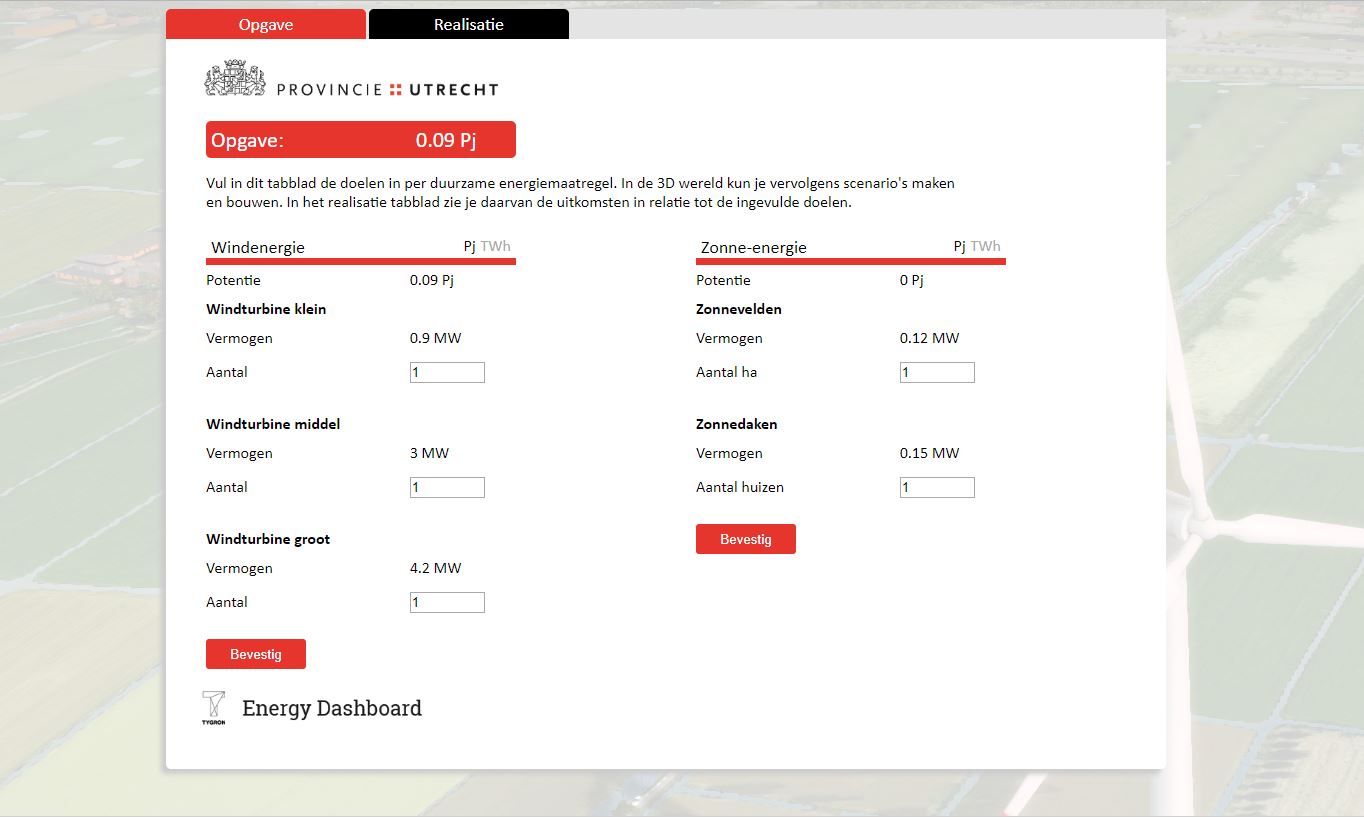
This dashboard makes tasks such as the housing construction task and tensions in a specific region in relation to the total regional energy task tangible and insightful for administrators and local residents. Another example is the projects dashboard of Tygron partner Aveco de Bondt. This dashboard visualizes various data flows and can automatically control the Tygron Platform and the Water Module. Scenarios can be calculated directly from the dashboard.
We offer the API water system training for hydrologists who want to get started with the Tygron API: Training API Watersystem.
