Urban planning is becoming increasingly complex due to the high demand for housing and the need for healthy urban living environments. In order to make informed decisions about this issue, it is necessary to integrate and visualize all data and calculation models in every phase of a project.
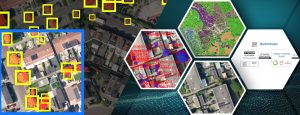
The province of Utrecht has developed a methodology to improve healthy urban area development. This method uses digital twin technology in which plans for the living environment are integrally modelled, analysed and visualised.
We call this methodology the GGO-methodology .The GGO methodology is a reusable digital twin technology for every municipality and every location that integrates, simulates and presents all the necessary data from the site. As a result, the effect of the city’s own urban development plans on health, climate adaptation and the environment can be recalculated.
Province of Utrecht shares new version of Healthy Urban Area Development indicators
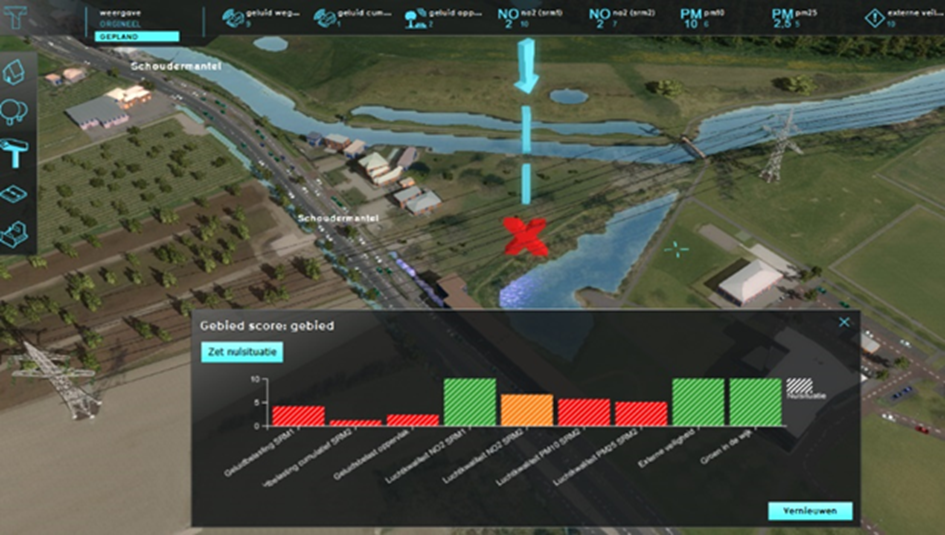
The Province of Utrecht strives to take health and safety into account optimally, systematically and in a timely manner when making environmental policy and implementing it. To support this aim, a set of indicators for Healthy Urban Area Development has been developed within the province that can provide insight into both the current state of an area and a future scenario for it. This concerns, for example, aspects such as noise pollution, air quality and external safety in an area.
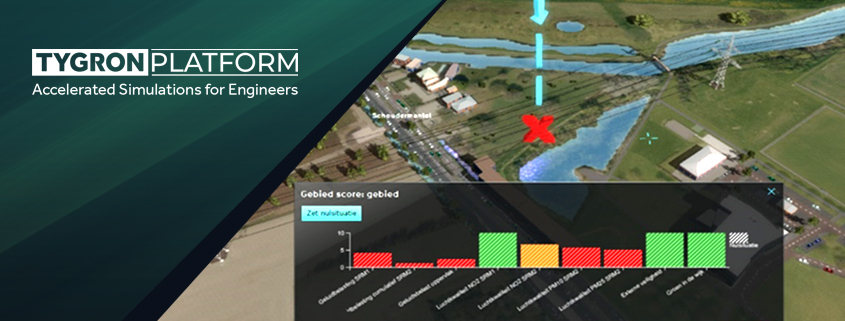
This set of indicators can be calculated in the Tygron Platform. This makes it possible to integrate all data from the methodology and to simulate the effects of plans in visualisation.
It is important for the Province that the method is transparent and that it can be widely applied. At the beginning of 2023, this set of indicators was therefore openly shared with all interested users, including those outside the province of Utrecht. In practice, this means that every area of the Netherlands can be calculated on the basis of the indicators. Subsequently, a housing plan can be uploaded (e.g. a dxf, see How to import AutoCAD DXF files) and this plan can be recalculated .The impact of the plan is made transparent in a clear dashboard.
On June 1, 2024, a new version of the indicator package was released. New additions are:
- A number of new indicators have been added, for example in relation to greenery and water, and for giving heat stress a ‘score’.
- The dashboard is now also available to all users as part of the template.
On this website of the province of Utrecht you will find everything about the indicators, their backgrounds and the approach: Handbook GMO Digital Twin Province of Utrecht – Handbook GMO Digital Twin Province of Utrecht (provincie-utrecht.nl) (in Dutch)
For more information about the approach, see the presentation by Luc de Horde of the province of Utrecht during the Tygron CoP of November 6, 2024: View presentation
All users of the Tygron Platform can apply this approach directly in their projects by choosing the template ‘GMO Template V2’ when creating a new project:
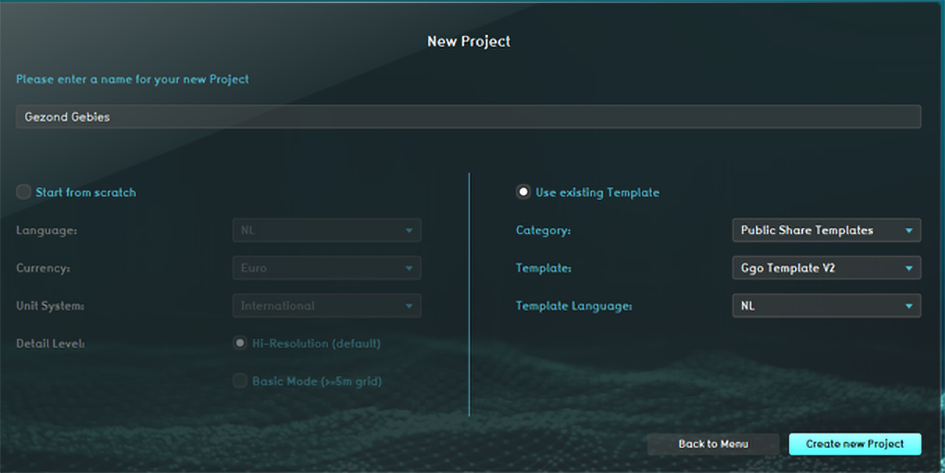
They can also add the indicators to existing projects by downloading them from the Public GeoShare. (GeoShare – Tygron Support wiki)
We invite everyone to get started with the renewed template!