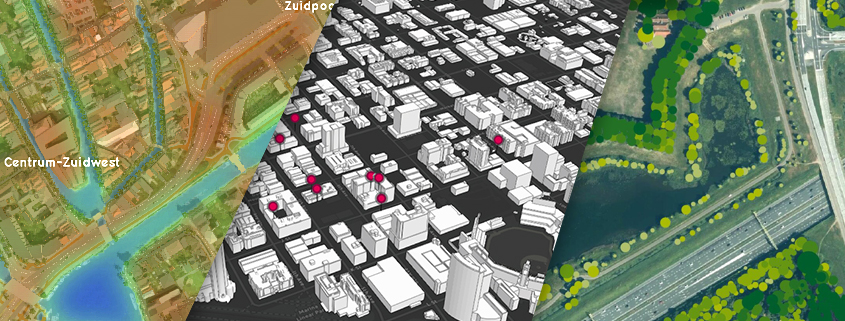
Suppose you are a policy officer and you are concerned with the future green design of your municipality. You must take complex aspects such as flooding, heat stress and affordability into account. You know that there is a lot of data available about these subjects and that there are smart tools to calculate this, but how do you make all those smart applications usable for yourself? Without having to spend your valuable time learning to work with new IT infrastructure?
In a development sprint on August 20 and 21, 2024, we worked with Esri Nederland and Cobra groeninzicht on a workflow to make this possible.
Do your own calculations with a supercomputer
The Tygron Platform makes it possible to carry out analyzes of the living environment very quickly, in such a way that it is integrated into existing work processes. We do this by focusing on High Performance Computing, which allows enormous amounts of data to be integrated, analyzed and visualized very quickly. We also optimize the connectivity of data and applications, for example by working with open standards and an open API.
Specialist knowledge and data integrated
ESRI tools are widely used to make and analyze data about the living environment usable. Cobra Groeninzicht has a lot of ‘green’ data and expertise about trees, their value for the living environment and their growth scenarios over time. By linking the Tygron Platform calculation engine to ESRI tooling and enriching it with data and knowledge from Cobra groeninzicht, you get ESRI tooling on steroids. Together with the technicians from ESRI Netherlands, Cobra groeninzicht and Tygron, we have developed this into a demo.
The demo: scenarios calculated at the push of a button
Users can load a plan for planting and/or felling trees in their familiar ArcGIS environment or immediately perform this action in the online viewer.
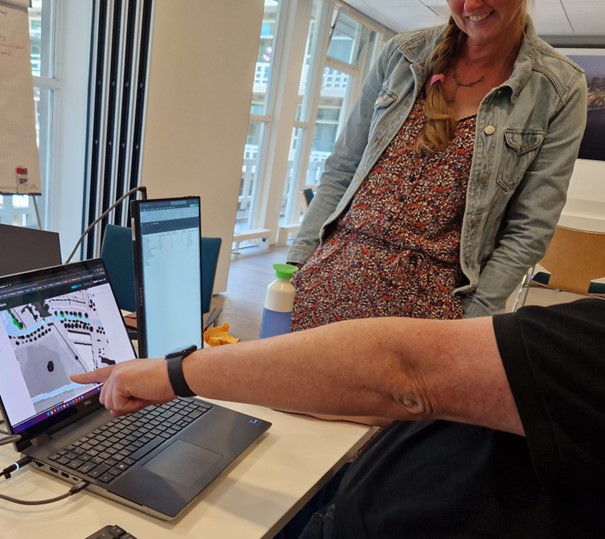
The effects of the plan on, for example, temperature and shade are calculated in the Tygron Platform, using expert information from Cobra groeninzicht. The effects are calculated for the short and longer term (0, 10, 30 and 50 years)
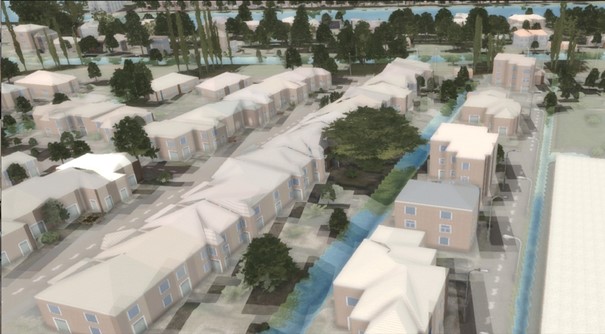
The calculation results are made transparent in an accessible dashboard based on ArcGIS.
We have integrated the following data and applications for this purpose:
- Tygron Platform DPRA Heat stress module for perceived temperature and shading.
- Tygron Platform API.
- Cobra Groeninzicht BomenMonitor with information about, trunk position, crown volume, ecosystem services, species information and growth models among other things.
- ESRI Experience Builder.
- ArcGIS Notebooks.
- ArcGIS Online.
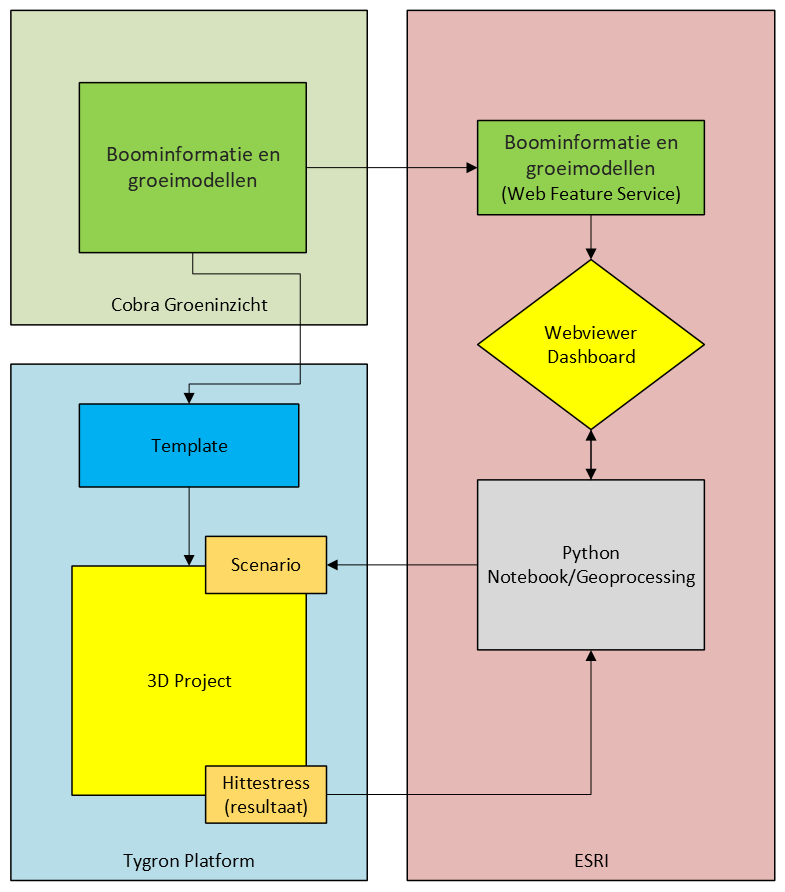
This way, as a policy officer or designer, you can easily gain insight into the impact of different green scenarios, now and in the future. The extreme computing power of a supercomputer and the specialist data from Cobra groeninzicht are easily accessible online via Arcgis.
The workflow will be further developed in the coming period together with various end users. Are you interested? Please contact us.
