Tygron CTO Maxim Knepflé: “Calculating the entire Netherlands with SimNL offers many advantages”
During a recent session at the Tygron Community of Practice, CTO Maxim Knepflé delved deeper into the technical possibilities -and challenges- of the Tygron Platform for modeling large-scale spatial analyses.
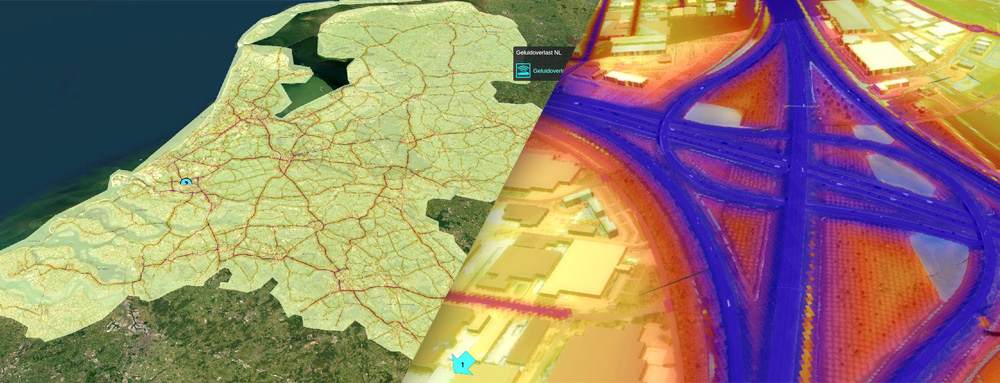
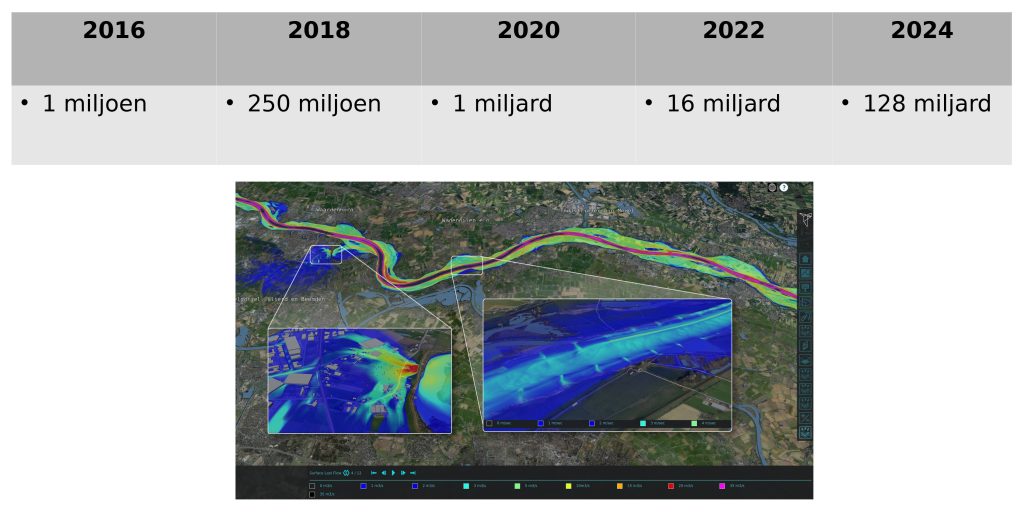
With the ambitious project SimNL, Tygron calculates the whole of the Netherlands at an impressive resolution of 1 by 1 meter with a total of 1 trillion grid cells (“That’s a one with twelve zeros”). Knepflé emphasized the importance of data quality and efficiency in processing processes to obtain reliable results. “Shit in, shit out,” he said, indicating that the quality of the input data is crucial for the success of the model. However, one often encounters the problem that this input data is not always fully available.
Roadmap Supercomputer
The Tygron Platform offers unique capabilities to model complex environmental data at scale, but there are significant technical challenges. For example, datasets, especially when deployed at the scale of an entire country, can become enormously large. In the example given by Knepflé, it was “1 trillion cells, about 4 terabytes.” He continued: “Our machines can handle that, but it fills up very quickly.” Therefore, a specific compression technology was developed to process the data ‘on-the-fly’. This technique, ‘block compression’, makes it possible to compress and read data quickly without the limitations of traditional compression methods such as zip files.
SimNL uses a whole range of datasets, including BAG, BRP crops, NWB Roads plus RWS traffic intensity, IMWA Water features and aerial photos at a resolution of 25 centimetres. It is of course also possible to load your own datasets.
SimNL Webviewer
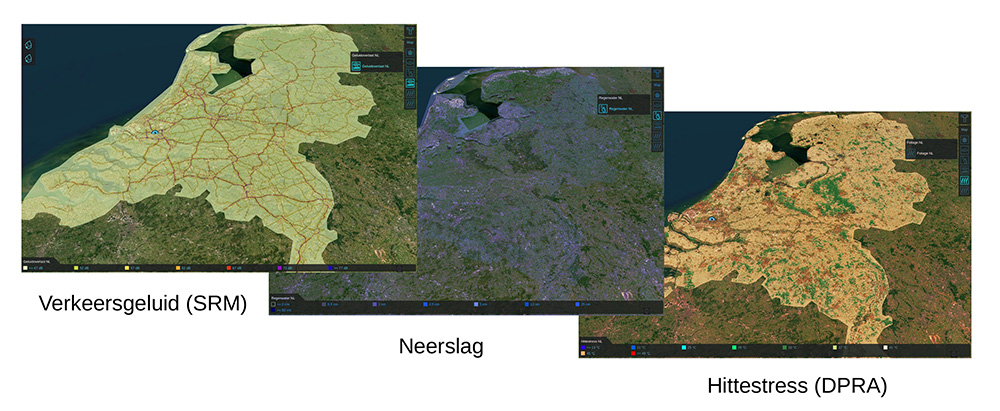
3D Web viewer from all over the Netherlands provides live model results.
Optimization
In addition to data compression, Knepflé also talked about optimizations in the visualization of 3D models within Tygron. Traditionally, rendering detailed models can be time-consuming, especially when it comes to large-scale projects. Knepflé said that in recent months they have been able to speed up the start-up and saving of projects, which also allows larger projects to run smoothly. The renewed 3D web view has now also been improved for the higher zoom levels, which is particularly noticeable because details are displayed more smoothly. According to Knepflé, this update is a major step forward: “I had a new record on my mobile phone, I could load the entire Netherlands into the web viewer and scroll through it.”
The practical applications of such a system are legion. An example of this is the possibility to calculate the impact of a so-called ‘Limburg shower’, a scenario with extreme rainfall of, for example, 100 mm of precipitation in a short period of time. With SimNL, cities and water boards can accurately predict where flooding will occur, how long areas will remain under water, and which infrastructural measures are needed to limit damage. But a combination with real-time data is also conceivable. “For example, you can connect Buienradar to it and immediately calculate the impact of an approaching rain shower. People can then immediately warn and help to prevent a disaster like the one in Spain.”
The role of AI
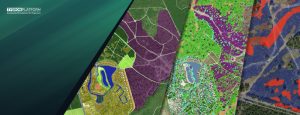
Another important theme during the session was the role of AI in improving data analysis and accuracy. Knepflé described how AI makes it possible to recognize patterns in the available data and detect errors. For example, in order to perform meaningful analyses in the absence of detailed data for certain areas, a model such as the Tygron Platform can “automatically recognize heathland, forest, sand, meadows, or other features based on satellite images.”
Tygron also looks beyond the Netherlands. The platform offers worldwide support for analyses, partly through the use of open data sources such as ESRI’s global elevation map and OpenStreetMap. This allows users anywhere in the world to start spatial analyses based on the same standards and insights that have been developed in the Netherlands. As Knepflé summarized: “If you can use that to build your environment with some smart algorithms, that is very useful.”
Download presentation (PDF format)
This presentation contains a number of links to projects. Not all links are active at the moment. If you would like more information, please contact us info@tygron.com
