As a result of climate change, there is an increase in the amount and duration of heat waves in the Netherlands (KNMI, 2020). Heat stress resulting from these heat waves can cause a wide range of problems in cities. For example, drinking water quality and labour productivity decreases, while water- and energy consumption increases. There is also an increase in heat related illnesses and mortality (EPA, 2019). Adaptation to these heat waves is essential, to remain a moderate temperature in cities. Planting trees is a frequently used measure to decrease heat stress. Considering the often limited amount of space in cities, trees are often either placed along roads, or placed in groups, such as in parks. With this research project I have researched which design is most effective in reducing heat stress. I did this using the DPRA Heat Module of the Tygron Platform.
I am Max Brink, a third year student of the Bachelor International Land and Water Management at Wageningen University. The last half year I have followed the minor Geo-information for Environment and Society. The last course of this minor (Geo-information Science for a BSc research project) included an individual research project of 4 weeks, in which I did this research.
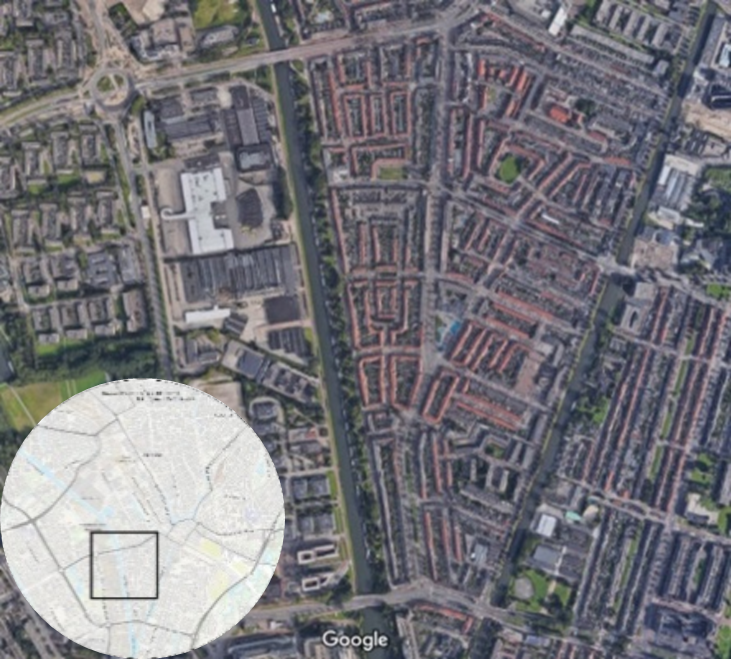
In cities, heat stress is aggravated because of the Urban Heat Island effect (UHI). The UHI is the phenomena that the urban environment is much hotter compared to its rural surrounding (EPA, 2008). An example of a city in the Netherlands which displays this phenomena clearly is Utrecht. For my research project I have chosen the Rivierenwijk in Utrecht as research area. This is one of the neighbourhoods in Utrecht with the least amount of trees. Furthermore, the area has a variety of different land uses, which could give an indication for the city Utrecht as a whole.
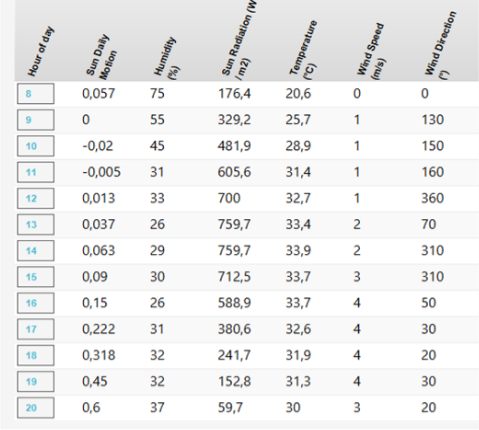
In August 2020, a heat wave of 13 days took place in the Netherlands. The highest temperature of this heat wave was measured on August 8, with a peak temperature of 34.6 °C (KNMI, 2020). Therefore, I chose this day for my research. Within the settings of the DPRA Heat Module (The Heat Overlay Configuration Wizard), weather parameters for a certain weather station could be entered. The closest weather station to my study area was De Bilt. Transforming the data from this weather station to the Heat Module Configuration Wizard required some minor calculations. But this was all explained extensively in the Tygron Support Wiki.
The DPRA Heat
Module in the Tygron Platform uses the Physical Equivalent Temperature (PET/gevoelstemperatuur) to determine heat stress. The module is developed in accordance with the 2019 DPRA Heat Stress Report (Ontwikkeling Standaard Stresstest Hitte) (RIVM, 2019). This report provides a standard for measuring heat stress in the Netherlands (Tygron Support, 2020). Because Tygron automatically connects to open geo-data sources, no further input was required.
To determine the impact of the two measures I ‘planted’ approximately 240 trees for each measure, within the Tygron Platform. After some trial-and-error I managed to plant the trees. For one situation I planted the trees in rows along roads and for the other I planted them in groups, like parks. Tygron has the option to choose various types of
kiezen. Het meest representatief voor mijn onderzoeksgebied was het standaard loofboomtype
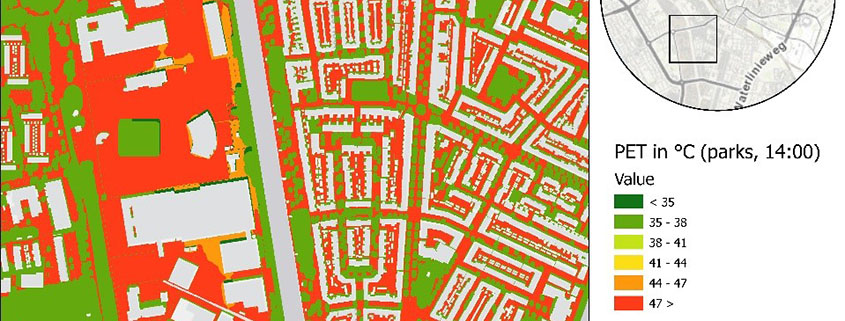
After planting the trees, I added the DPRA Heat Module. With the Export Geo Data option in Tygron I exported my results to ArcGIS Pro. In ArcGIS Pro I changed the symbology of the final PET maps. One of these maps can be seen in figure 3.

To determine the effect of the measures more clearly, I used the option in the DPRA Heat Module to make difference maps. These maps show the increase or decrease of the PET temperature after applying the measures. An example has been showed in figure 4. Both measures mainly caused a decrease in heat stress. However, this effect was restricted to the area covered by the trees. The areas surrounding the newly added trees also had a significant increase in heat stress. When looking at several factors separately I concluded this was mainly caused by a decrease in wind speed.

Met behulp van de schermopnameopties in Tygron exporteerde ik de resultaten naar mijn eindwerkstuk. Verder heb ik ook video's gemaakt van de verschillende kaarten, met de videofunctie in Tygron. Ik heb deze video's opgenomen in een extra ESRI Storymap, die je hier kunt hier. I used this Storymap for the final presentation of the course.
Finally, I concluded that the most effective way of planting trees in Utrecht to reduce the PET during a heat wave will include a mix of both trees placed in rows as well as trees placed in groups. Trees placed in rows will provide shadow for the main pedestrian sidewalks of an area. For urban planners it will be important to consider the possible increase in heat stress surrounding the placed trees. This increase, mainly caused by trees blocking the wind, is most severe between small streets. Design choices, such as placing trees on one side of the road in order to have open space for wind on the opposite side of the road, can help limit this negative effect. Trees placed in groups will provide new cool places in the area.
The Tygron Platform is a helpful program for these type of research projects. Especially the combination of the available overlays and the open geo-data make the program very useful. During the research project I decided that I wanted to use the Tygron Platform within my internship and thesis research as well. Tygron helped me find an internship at the consulting and engineering firm TAUW. Currently, I am doing research at TAUW to develop a better night heat stress map for the Netherlands, using the Tygron Platform.
More information about this type of research projects in education can be found in the Tygron voor GIS data page in the Tygron 2021 EDU Manual, which can be found hier. The full research report I made during the course can be found hier. Feel free to email me info@tygron.com.
References
- (2019, 2 December). Heat Island Impacts. US EPA. https://www.epa.gov/heat-islands/heat-island-impacts#emissions
- EPA (U.S. Environmental Protection Agency). (2008). Reducing urban heat islands: Compendium of strategies. https://www.epa.gov/heatislands/heat-island-compendium
- KNMI (Koninklijk Nederlands Meteorologisch Institituut). (2020). Hittegolven (sinds 1901). https://www.knmi.nl/nederland-nu/klimatologie/lijsten/hittegolven
- Rijksinstituut voor Volksgezondheid en Milieu (RIVM). (2019, August). Ontwikkeling Standaard Stresstest Hitte. https://doi.org/10.21945/RIVM-2019-0008
- Tygron Support. (2020, February 14). DPRA Heat Module – Tygron Support wiki. Support Tygron. https://support.tygron.com/wiki/DPRA_Heat_Module
