Traffic: more possibilities with data
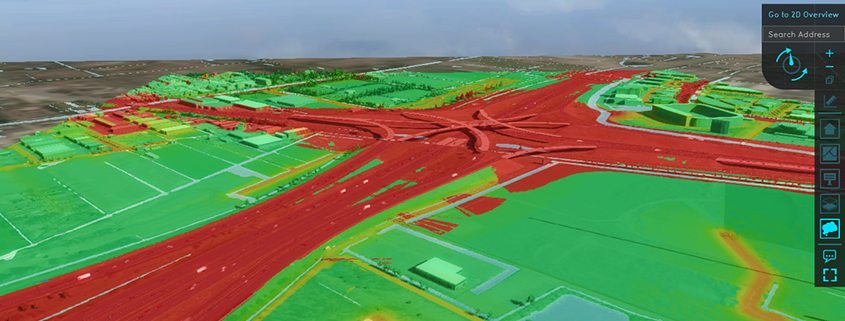
The possibility to integrate NSL traffic data (https://www.nsl-monitoring.nl/informatie/data-nsl/) and use them in calculations. Use different numbers for day/evening night (noise) and weekdays (air pollution). https://youtu.be/_4pHhTyq1e4https://youtu.be/QHyILGCh0Kc
Prequels: relating overlays
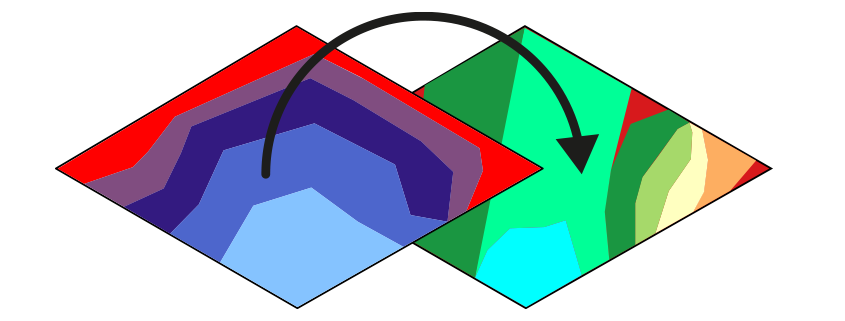
The possibility to use one overlay as input for another in calculations. There are many applications, such as using a Subsidence Overlay as input for a Water Overlay, or using […]
XC-query
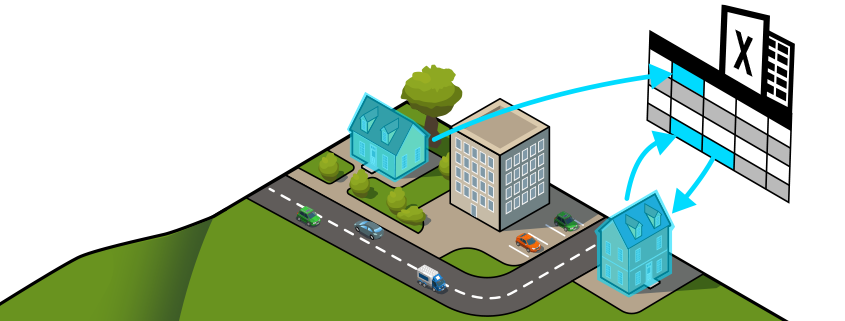
XC-Query option that selects all items in e.g. a neighborhood. This is useful for e.g. selecting all residential houses in a neighborhood. Related documentation: https://support.tygron.com/wiki/X_query_(Excel)
Performance updates
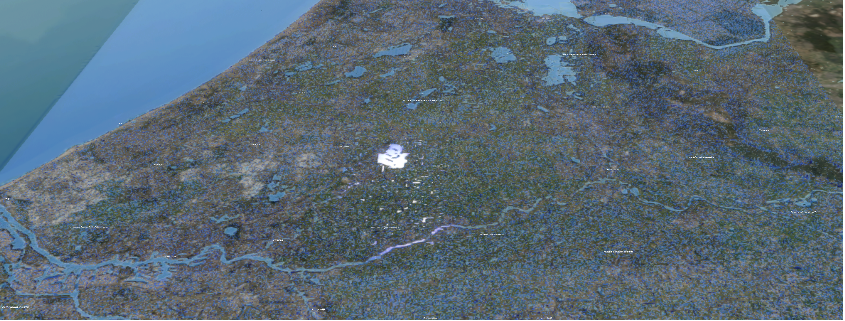
Continuous improvement of Tygron’s HPC capacity. Tygron has now reached a 10 billion grid calculation record: https://www.tygron.com/nl/2021/11/30/tygron-supercomputer-hits-new-record-10-000-000-000/ Grid Overlays can be resized to 25cm and max 5 billion cells.
Wizard for Noise, Air Quality and Travel Distance Overlay
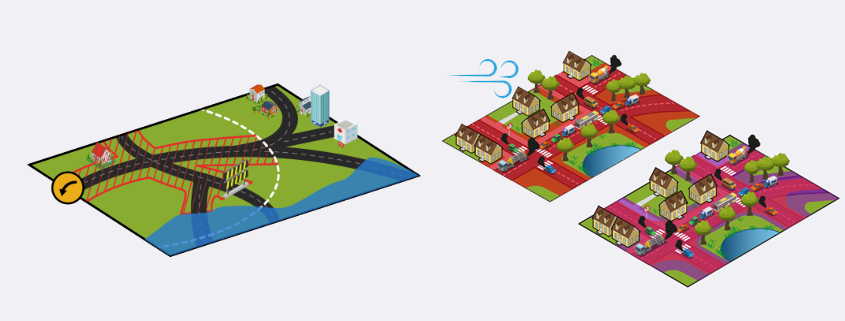
Improvement of transparency and possibilities to adjust settings by introducing configuration wizard for Noise, Air Quality and Travel distance overlays.
More data from data sources
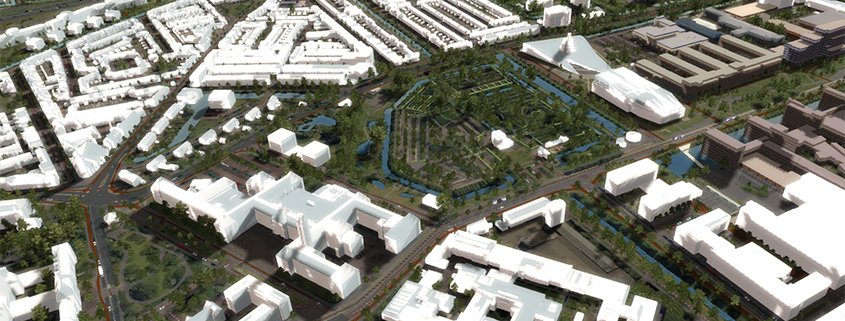
Automatic collection of more data from data sources. In the Netherlands: Average Resident information from CBS Energy labels for adresses 3D BAG (TUDelft 3D geoinformation group, https://3dbag.nl/en/viewer) New types of […]
Security updates

Continuous improvement of measures to protect data and projects. Among others, improved measures to deal with Brute-force attacks
Extended Combo and Average Overlay functionalities

More options to work with the Combo and Average overlays such as:– timeframe support– percentile option in the Combo Overlay– attribute arrays– No-data interpolation in Average Overlay https://youtu.be/Vh0N_svlSjUhttps://youtu.be/VsJjZfvYumU Read more: […]
Groundwater: Improvement of yearround calculations
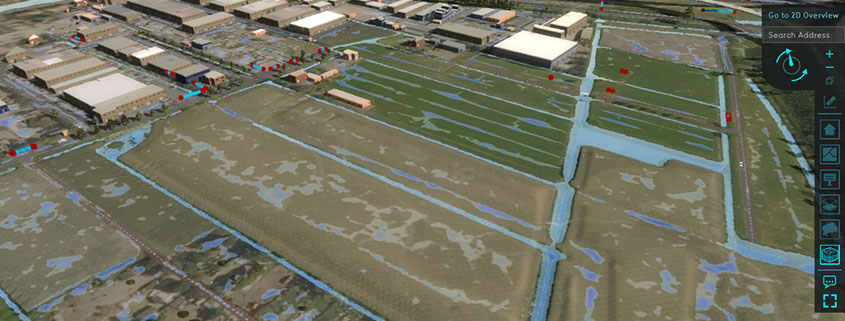
Improvement for realistic simulation year round groundwater under wet circumstances (e.g. Peat meadows). Adjustment of het averaging algorithm such that only in case water on land is higher than a […]
FEATURE REQUEST – User-friendly method of exporting result of spatial calculations as images
As a data creator/analist, I would like a user-friendly way to export the results of overlays as images, so that it becomes easier to convert the raw calculated results to […]
